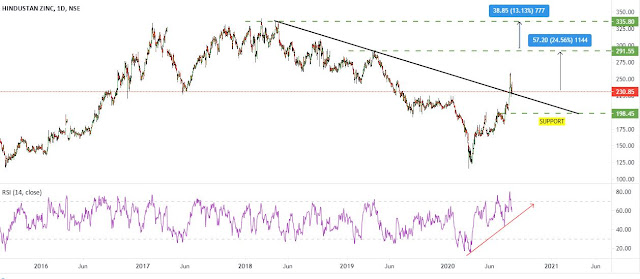
Chart of the WEEK (17 Aug to 21 Aug 2020)
# Hindzinc Daily chart trading above major #Trendline and now trading above resistance level, if the stock sustain above we can see up move towards 290.00/330.00 level as per chart pattern with the help of 195.00 support level .
# Tube Investment of India has broken out from a Lifetime high Resistance of 577.00 on both daily & weekly chart indicating strong participation by the bulls.
• The stock is trading above all major moving averages (20, 50,100 & 200 SMA) indicating strong uptrend.
# Volumes are rising indicating increased participation by the bulls .
# We can see upmove towards 690.00/780.00 with help of 500.00 support level.
Thanks for reading and please let us know if you have any questions


Comments
Post a Comment