Posts

Showing posts from 2020

Chart Of the Week ( 28 Dec 2020 to 01 Jan 2021)

Image
 # CIPLA in both daily & weekly time frame made rectangle pattern and breakout already happened on 24 Dec 2020.With the support of 790.00 level this stock will move towards 900.00/1000.00 . Click on the chart to enlarge view. Thanks for reading and kindly let us know if you have any questions!

Chart of the WEEK (24 Aug to 28 Aug 2020)

Image
*   #Vindhya Telelinks Limited   is engaged in manufacturing and sale of Cables (telecommunications cables, other types of wires & cables etc.) and Turnkey Contracts & Services business.   As per the govt of india all villages to be connected with optical fibre in next 1,000 days.In this case I think the biggest beneficiary is VTL.    Source - https://timesofindia.indiatimes.com/business/india-business/all-villages-to-be-connected-with-optical-fibre-in-next-1000-days-pm-modi/articleshow/77558650.cms   Stock is trading at 0.43 times its book value   All above parameter indicating that Vindhya telelinks limited ready for upmove.    Vindhya Telelinks Limited   Daily/Weekly chart trading above its resistance level,if  sustain above (resistance level mentioned in the chart) this we can see up move towards 1000.00/1200.00 level as per chart pattern with the help of 750.00 support level .   H igh  volume  indicating increased participation in bulls. *#Asian Paints Ltd  Daily/Weekly ch

Chart of the WEEK (17 Aug to 21 Aug 2020)

Image
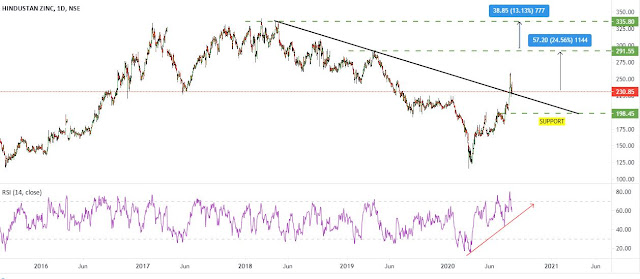
   # Hindzinc  Daily chart trading above major #Trendline and now trading above resistance level, if the stock sustain above we can see up move towards 290.00/330.00 level as per chart pattern with the help of 195.00 support level .  # Tube Investment of India has broken out from a Lifetime high Resistance of 577.00 on both daily & weekly chart indicating strong participation by the bulls.  • The stock is trading above all major moving averages (20, 50,100 & 200 SMA) indicating strong uptrend.  # Volumes are rising indicating increased participation by the bulls .  # We can see upmove towards 690.00/780.00 with help of 500.00 support level.              Thanks for reading and please let us know if you have any questions

Chart of the WEEK (10 Aug to 14 Aug 2020)

Image
                                                          * #Tata Power   Weekly/Daily chart trending in a trend line  and now trading near resistance level, if stock break 55.00 level and sustain above this we can see up move towards 70.00/80.00 level as per chart pattern with the help of 45.00 support level       * If #Tata Power break 45.00 level and sustain below level we can see major fall towards 30.00/25.00 level with the resistance of 54.5                * Weekly/Daily chart :- *   * #Universal cable  Weekly/Daily chart trending above its important resistance level ,if it sustain we can see up move to wards 154.00/180.00 level with the help of 105.00 support level .                                 * Weekly/Daily chart :-        * #Lincoln Pharma   Weekly/Daily chart trending   above its important resistance level ,if it sustain we can see up move to wards 270.00/300.00 level with the help of 190.00 support level                               .      Thanks for reading and please

NSE Co-location SCAM

Image
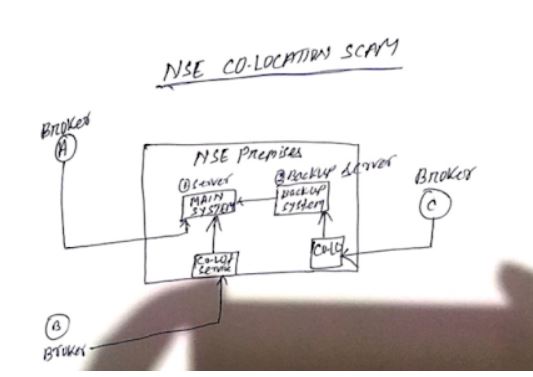
  What is co-location? Co-location allow brokers to operate closer to their servers upon payment of additional fees. It helps brokers secure advantage over others due to proximity to exchange servers as data transmission takes less time. Orders reach exchange servers faster than those who have not availed of the facility What is the scam? A whistleblower in 2014-15 complained to the Securities and Exchange Board of India (Sebi) saying some brokers in collusion with a few top NSE officials had abused the colocation facility. NSE was then using the so-called tick-by-tick (TBT) server protocol to relay data to members. The peculiar part about this protocol is how it delivers the information. Normal data protocols send data to all users connected on the network at the same time. But TBT transmit in the sequence of orders received. In other words, the user who gets the access to the system first would receive data earlier than the rest. A select set of brokers in collusion with NSE official

Is Technical analysis bullshit ?

Many people don’t recognize technical analysis and says TA is useless before doing any homework to even fully understand what it is or how it should be used.TA is bullshit after like saying no one can make any money in the stock market because some academics did a study and didn’t make any money. There are as many ways to use technical analysis as there are ways to make money in the stock market. Stock market participants range from day traders to value investors from option traders to futures traders and technical analysis is just as diverse. It is the peak of arrogance for someone to think they can dismiss the entire art and science of technical analysis because they can’t figure out how it works or how to make it work. Many traders spend thousands of hours to construct profitable trading strategies using some form of TA. The right question is not “Does technical analysis work ? or Is technical analysis BS ? but to first quantify and specify what exactly do you think technical ana