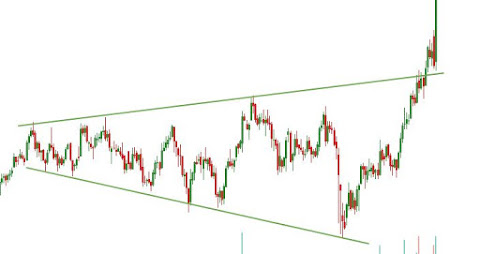
MegaPhone Chart Pattern ??
* Megaphone pattern is a pattern which consists of minimum two higher highs and two lower lows. The pattern is generally formed when the market is highly volatile in nature and traders are not confident about the market direction. Normally this pattern is visible when the market is at its top or bottom. The greater the time frame is better the pattern will work. However, traders love this pattern when it is formed in a daily or weekly time frame.
Key Points :-
* Megaphone pattern is a pattern that consists of minimum of higher highs and two lower lows.
*The pattern is generally formed when the market is highly volatile in nature and traders are not confident about the market direction.
*Megaphone pattern is known to give multiple trading opportunities to the trader.
*This pattern also can be traded when it fails but is necessary to identify the failure perfectly.
*Sometimes only pattern is not enough to take best trading decisions you may need multiple indicators to identify better entry and exit points.
How to identify the Megaphone pattern ??
* Generally, Megaphone Pattern consists 5 different swings. But the swing has to have minimum two higher highs and two lower lows. A trend line is drawn by connecting point 1 and point 3 while point 2 and 4 are also joined together to draw a line. These two lines create a shape which looks like a megaphone or inverted symmetric triangle.
Below are a few characteristics of Megaphone trading pattern:
*Volume plays an important role when it comes to the recognition of this pattern.
*In the Megaphone Top, volume usually peaks along with prices.
*An increase in the volume , on the day of the pattern confirmation is a strong indicator.
Theoretical ways to trade the Megaphone pattern:
*Megaphone pattern is known to give multiple trading opportunities to the trader.
A trader can trade Megaphone pattern as Breakout Trades
Swings trades (while making higher highs and lower lows)
Breakout Trades:
When the price breaks the trend line after making the 5th swings and closes outside the pattern boundary, a breakout is confirmed. Breakout may happen in positive or in a negative direction. Depending upon the market condition and the position of the pattern in the chart, bullish and bearish breakout happens.
After a prolonged bull run, when this pattern is formed at the top and the price closes below its lower trend line , then it acts as a trend reversal pattern.
But, if the price closes above the higher trend line and makes new higher highs in the chart then it will be termed as a Continuation Pattern. Traders can take a trade when price closes outside the pattern boundary (in whichever direction) to get the best possible confirmation of the breakout.
For educational Purpose Mega phone Pattern Under construction stocks are below-
* V Guard Industries
*Solar Industries Limited.
*Blue Star Limited.
*Rattan India .
Kindly Let us Know if you have any Questions.


nice analysis
ReplyDelete