Posts

Historical Budget Dates in India

Historical Budget Dates in India :-  July 05, 2019   February 1, 2019 February 1, 2018 February 1, 2017 February 29, 2016 February 28, 2015 July 10, 2014 February 17, 2014   February 28, 2013 March 16, 2012 February 28, 2011 February 26, 2010 July 6, 2009 February 16, 2009 February 29, 2008 February 28, 2007 February 28, 2006 February 28, 2005 July 8, 2004 February 3, 2004 28 February, 2003 February 28th, 2002 February 28th, 2001 February 29th, 2000 February 27th, 1999 1st June, 1998

Chart Of The Week ( 24 January 2021)

Image
  1) Jubilant Life Science Limited (JUBL)- Click on the chart to enlarge view. C MP-934.00 RECO-Buy Entry Range-Rs.900.00–950 Target-1250.00/1500.00 Stop Loss- 840.00 Closing basis Duration- 06 to 12 months *Stock has given a Inverted H & S Pattern breakout on weekly chart and trading near lifetime high on weekly basis. *If we look at the volume part, significant volume activity is witnessed at the time of breakout. *Price has also trading all the important moving averages. *Considering all technical evidences we may see good up move in Jubilant Life science Limited. 2) Minda Industries Limited - Click on the chart to enlarge view. CMP-489.00 RECO-Buy Entry Range-Rs.450.00–500.00 Target-600.00/820.00 Stop Loss-400.00 closing basis Duration- 06 to 09months *Stock has given a 2.5 years long consolidations breakout on weekly chart. *If we look at the volume part, significant volume activity is witnessed at the time of breakout. *Price has also trading all the important moving aver...

Chart Of the Week (11 January 2021)

Image
   Rail Vikas Nigam Limited (RVNL)- Click on the chart to enlarge view. CMP-33.25     RECO- Buy     Entry Range- Rs.30.00-35       Target-42.00/60.00      Stop Loss- 23 Closing basis     Duration-  06 to 12 months *Stock has given a Cup and handle Pattern breakout on weekly chart and closing above lifetime high on weekly basis. *If we look at the volume part, significant volume activity is witnessed at the time of breakout. *Price has also trading all the important moving averages. *Considering all technical evidences we may see good up move in RVNL. Fertilizers & Chemical Travancore Limited(FACT)- Click on the chart to enlarge view CMP-76.00     RECO- Buy     Entry Range- Rs.70-80.00       Target-108.00/160.00      Stop Loss-60.00 closing                            ...

Chart Of the Week (04 Jan to 08 Jan 2021)

Image
 Bharat Electronics Limited(BEL)- Click on the chart to enlarge view. CMP-126.24     RECO- Buy     Entry Range- Rs.120-130       Target-160.00/220.00      Stop Loss- 106      Duration- 06 months *Stock has given a bullish Inverted H & S Pattern on weekly chart. *If we look at the volume part, significant volume activity is witnessed at the time of breakout. *Price has also trading all the important moving averages. *Considering all technical evidences we may see good up move in BEL. The Tinplate Co of India  - Click on the chart to enlarge view. CMP-167.00    RECO- Buy     Entry Range- Rs.155-170      Target-225/325.00      Stop Loss- 145 closing  basis Duration-  06 to 09 Months.                                            ...

Chart Of the Week ( 28 Dec 2020 to 01 Jan 2021)

Image
 # CIPLA in both daily & weekly time frame made rectangle pattern and breakout already happened on 24 Dec 2020.With the support of 790.00 level this stock will move towards 900.00/1000.00 . Click on the chart to enlarge view. Thanks for reading and kindly let us know if you have any questions!

Chart of the WEEK (24 Aug to 28 Aug 2020)

Image
*   #Vindhya Telelinks Limited   is engaged in manufacturing and sale of Cables (telecommunications cables, other types of wires & cables etc.) and Turnkey Contracts & Services business.   As per the govt of india all villages to be connected with optical fibre in next 1,000 days.In this case I think the biggest beneficiary is VTL.    Source - https://timesofindia.indiatimes.com/business/india-business/all-villages-to-be-connected-with-optical-fibre-in-next-1000-days-pm-modi/articleshow/77558650.cms   Stock is trading at 0.43 times its book value   All above parameter indicating that Vindhya telelinks limited ready for upmove.    Vindhya Telelinks Limited   Daily/Weekly chart trading above its resistance level,if  sustain above (resistance level mentioned in the chart) this we can see up move towards 1000.00/1200.00 level as per chart pattern with the help of 750.00 support level .   H igh  volume  indica...

Chart of the WEEK (17 Aug to 21 Aug 2020)

Image
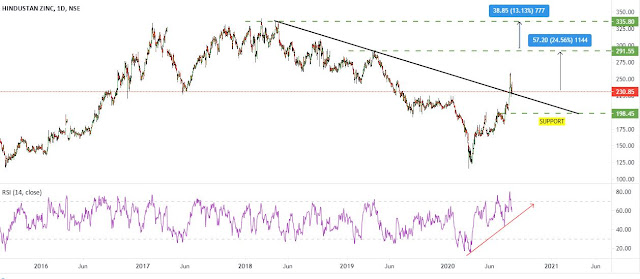
   # Hindzinc  Daily chart trading above major #Trendline and now trading above resistance level, if the stock sustain above we can see up move towards 290.00/330.00 level as per chart pattern with the help of 195.00 support level .  # Tube Investment of India has broken out from a Lifetime high Resistance of 577.00 on both daily & weekly chart indicating strong participation by the bulls.  • The stock is trading above all major moving averages (20, 50,100 & 200 SMA) indicating strong uptrend.  # Volumes are rising indicating increased participation by the bulls .  # We can see upmove towards 690.00/780.00 with help of 500.00 support level.              Thanks for reading and please let us know if you have any questions